
Community Archive (Customer) asked a question.
Local Poller Avg Lag exceed 700 ms
Hello,
I just found a big problem on my Whats'up Server :
Can you help me to solve this ?
Vm on Windows server 2016
4 Vcpu / 8 Gb RAM
Windows 2016 Up to date
Last patch applied
Ok, sorry for the delay.
I test the solution to add memory (+4gb) Not solve the problem.
AV is not installed on the vm / Win Defender Off so it wasn't the source of the problem.
I checked the Logger Health Messages and i didn't see anything with non existing vms.
I run the database utilities also....
So, I tried to remove all my items exept my vcenter (approx 60 vms) and i it solved the problem !
Since i did that, I rescan a lot of my items, (miss the switchs) remove some monitors that i do not want (for ex : interfaces on the AP) and the lag is not there anymore ...
Thank you for your answers.
@Willem de Groot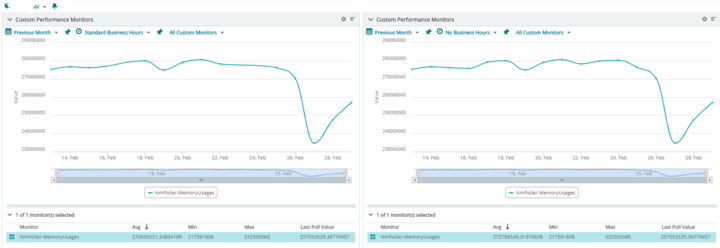
Might I suggest increasing the RAM on the VM? The Release Notes indicate 8GB RAM as the minimum required for 100 Devices / 500 Monitors with a footnote regarding several variables including polling frequency, types of monitors being used, etc. Your screenshot indicates 343 devices and a combination of Active and Performance monitors of 2,160. Increasing the RAM may assist with the issue.
https://docs.ipswitch.com/NM/WhatsUpGold2018/01_ReleaseNotes/#link21
Another common factor with Poller lag can also be Anti-Virus software. It is recommended to create exclusions for the entire WUG installation path, as well as the MSSQL installation path if using the included SQL Express or any local SQL instance. One thing you could try first is temporarily disabling AV to see if there is an improvement in performance. If so, then proceed with creating the exclusions.
You also mentioned you are using Virtual Monitoring. Please check the Logger Error Log (Analyze -> Logs -> Logger Health Messages). I've seen instances where VMs that were unreachable or no longer existed were causing errors to be thrown for the whatsvirtual service and causing Poller Lag and removing them from WUG cleared the issue as WUG no longer was wasting resources trying to poll non-existent devices.
I just recently experienced a similar issue with the slow local poller.
In reviewing the Logger Health Messages, there were several errors logged for the WhatsVirtual component. In seeing that, found a discovery/refresh scan that usually taskes 15 minutes and was still running 11 hours later.
Requesting a cancel on the schedule, and rebooting returned the poller back to normal.
WhatsUp Gold 18.3.1 Build 128 , Premium Edition
Virtual Monitoring and NTA
ok, no problem,
create on an Dashboard (Analyze / Dashboards / Homedashboard) 2 new "custom performance monitors", select your WuG Server instead of "My Network", now you can select the monitors to see in the graph. On one of the graphs you select the Memory, on the other the pollagtime. You have to use 2 due to the different "Value" ranges.
It takes some minutes like 10-15 minutes before the poller enter in "latemode"
In vpshere, i see no pb with RAM or CPU utilisation.
I created your active script and apply on my vm wich host what's up.
That's what you want ? Where do i check the results of your script ?
Sorryfor my dumb questions, it's a new product for me and we just starting to use it (newbies here). The installation was made by a certified resseller.
Hi
in the screenshot it says 744 Seconds (not milli)!!
Do you have this value direct after an service restart or does it take a while to get to this value.
Can you create an perf monitor to monitor the Lag time and the
and also one for the memory it uses.
I have an unsolved issue where the memory goes upto 3GB at this point the poll lag time get worse and I do an restart of the Ipswitch service.
Let me known what your expiriences are.
Willem
[Edited] Added the pictures
Additional info : in settings, when i restart nmpoller.exe, it's fine for 10-15 minutes with 0s of lag.
We use : WhatsUp Gold 18.3.1 Build 128 , Premium Edition
with Virtual Monitoring and NTA 5 sources