Since 11.6 of OpenEdge, the ability to view PROFILER output is built into Progress Developer Studio for OpenEdge (PDSOE).
To view a file in the Profiler Viewer in Developer Studio, first import it along with any dbg_ files that were generated for your session into your Developer Studio project. These are listed in the profiler output if you're not sure which ones to include.
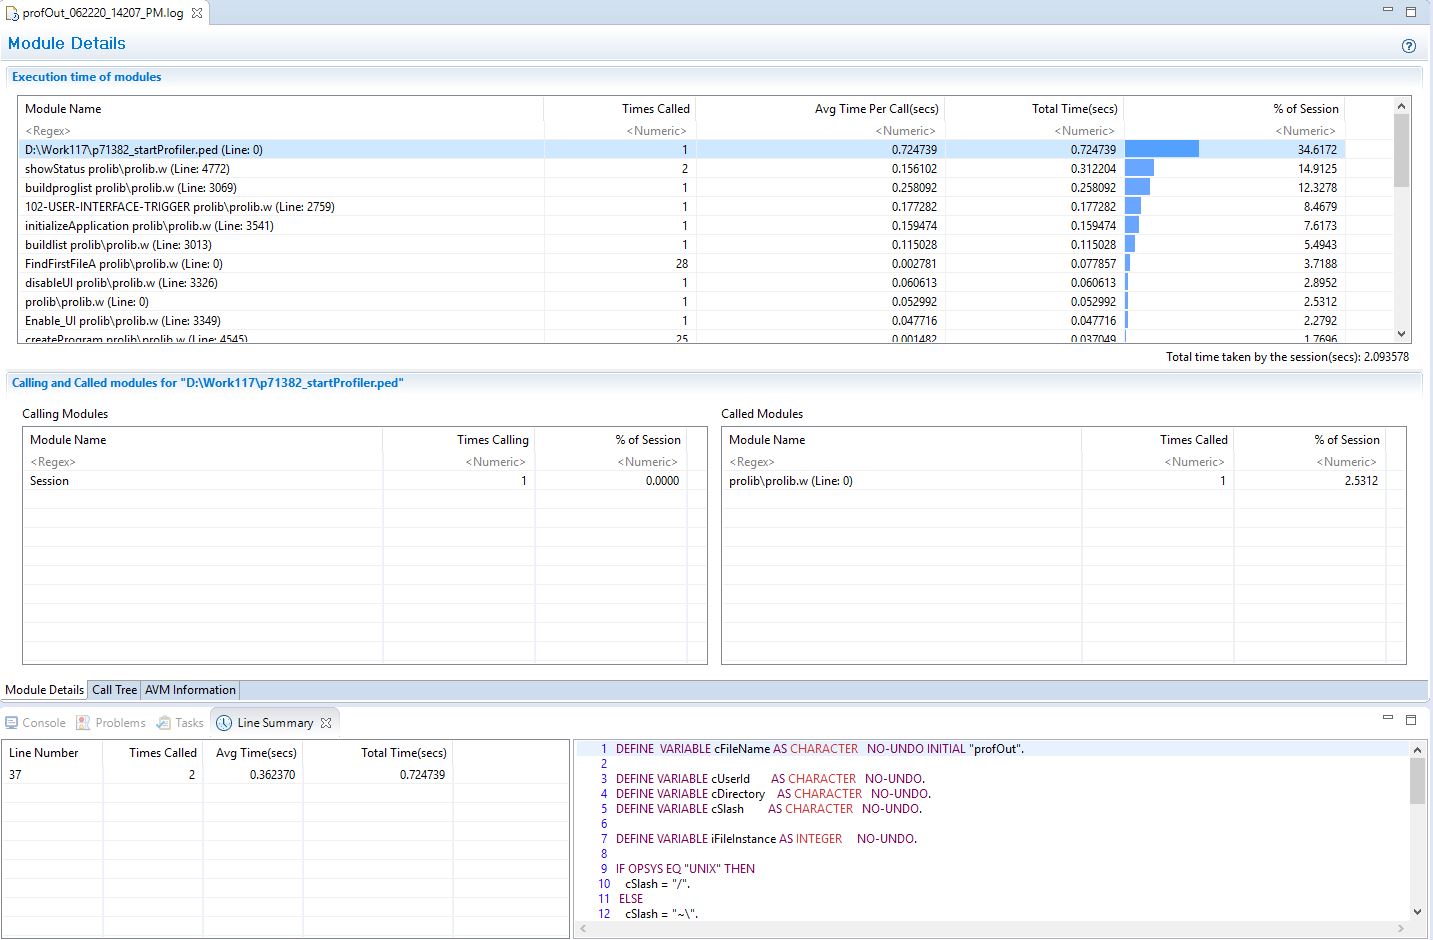
Next, Right-click the profiler output file and select Open With >> Other, then start typing "Profiler" to narrow the selection to the Profiler Viewer.